


Australian Share Market Performance
During times of share market volatility it’s easy to get caught up in headlines aimed to scare us from investing.
An article in the Age on 9th March 2015 had the headline ‘$24 Billion wiped off the ASX’, can be a little daunting when expressed this way. It went on to discuss how the share market fell 1.3% that day. What it failed to mention was the share market was up over 10% in the previous 2 months, which equated to many more ‘Billions’ added to people’s wealth.
Investing into share markets or other growth assets (such as property) is not a short-term prospect. You need to take a long-term view of at least 5 – 7 years. Focusing on just the year ahead, or the daily movements of share markets, you can easily get caught up in the hype and make irrational decisions. However, when we look at share markets over a longer term, we can start to see the benefits.
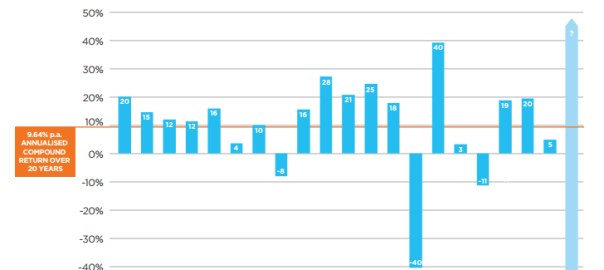
Constructed correctly, a share portfolio can bring rewards when a longer time frame is assessed. The following graph outlines the annual returns from the Australian share market (including dividends) over the last 20 years.
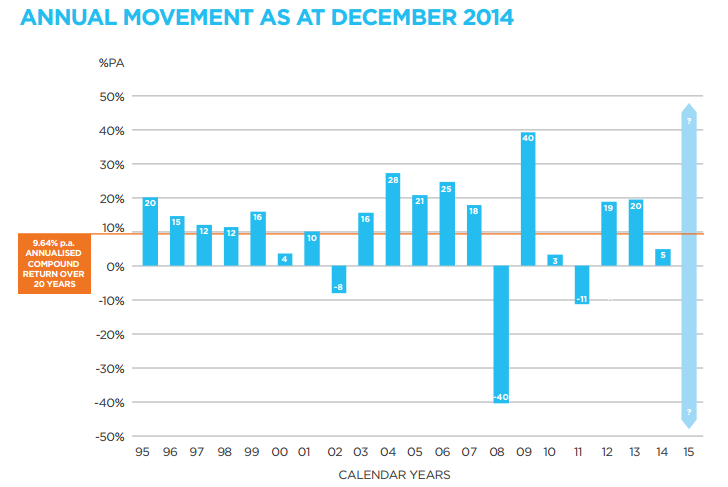
As outlined in the graph, there have been 3 negative years and 17 positive years since 1995. Over the last 20 years, 85% of years were positive, yet it is those negative years that get the most attention.
The average return has been +9.64% per year or 192% (since 1995). That includes a period where markets were heavily negative during the Global Financial Crisis.
It is important that you receive adequate advice when constructing share portfolios, as your time frame, investment risk profile, your goals, and the underlying investments need to be analysed. Investing is an area JBS are passionate about as we see the benefits it can provide our clients.
This passion leads us to produce a weekly newsletter on how share markets are performing. If you are interested in shares and want to increase your knowledge we ask you to subscribe to our weekly Monday Markets newsletter here.